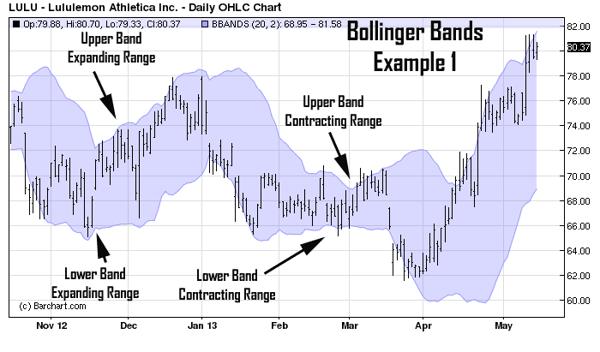
Bollinger Bands refer to trading indicators that John Bollinger created in the 1980s. John introduced them to the public through the Financial News Network where he first used the term ‘Bollinger Bands.’ He traded options at the time, and he developed these bands as he sought to analyze volatility in that market. Today, John works as a technical analyst in the finance industry. He is an author as well. How much do you know about these Bands that he developed? Well, here are 5 interesting things you should know about Bollinger Bands.

- 1. You Can Adjust Your Settings to Reflect Three Standard Deviations
Bollinger Bands help you analyze the market by showing you the movement of three lines. Each line represents a particular type of analysis. For example, the upper one represents plus 2-standard deviation while the middle one accounts for minus 2-standard deviation. The third one is the 20-period moving average. Many people fail to realize that adjusting the settings to reflect three standard deviations is possible. Doing so would help you identify an even higher number of overbought or oversold areas.
- A Squeeze Is an Indication of a Low Volatility Environment
The level of volatility in the market continually changes as it moves from a low-volatile environment to a highly volatile one and vice-versa. Determining when the market is in a low volatility period helps you prepare for the breakout. Fortunately, making this determination is possible if you look for a squeeze in Bollinger Bands. This squeeze occurs when the Bands contract. Interestingly, the more intense the contraction is, then the more powerful the breakout will be.
- Bollinger Bands Do Not Tell You the Direction of a Breakout
The primary objective of Bollinger Bands is to identify market volatility and heavily transacted areas. A critical part of this identification process is indicating when a breakout is likely to occur. However, Bollinger Bands do not tell you which direction the breakout will go. Fortunately, looking at the market trend tells you the most probable course. For example, an upward swing is likely if the market is on a skyward trajectory.
- 4. Ride the Trend by Trailing Your Stop-Loss with the 20-Period Moving Average
Stop-loss prices minimize potential losses in the market. Unfortunately, transactions costs increase if you apply them frequently. Riding the trend helps you reduce these costs because you will focus on the long-term performance of the market. Unfortunately, doing so exposes you to potential losses if the market fails to bounce back after it contracts. Fortunately, riding trends safely is possible if you trail your stop-loss with a 20-period moving average from Bollinger Bands.
- Combining Bollinger Bands and RSI Strategies Is an Excellent Idea
Reversals occur regularly in the market. They happen when the direction of a particular trend changes abruptly. Some analysts refer to it as a correction because it mostly occurs when a market is bullish or bearish for unexplained reasons. Unfortunately, Bollinger Bands will tell you when breakouts happen, but they will not indicate whether a reversal will take place afterward. Combining it with RSI is an excellent idea because RSI gives you an idea of whether a reversal is likely.
